s)-O{5;U�� 简介:
FRED作为COM组件可以实现与Excel、VB、
Matlab等调用来完成庞大的计算任务或画图,本文的目的是通过运行一个案例来实现与Matlab的相互调用,在此我们需要借助脚本来完成,此脚本为视为通用型脚本。
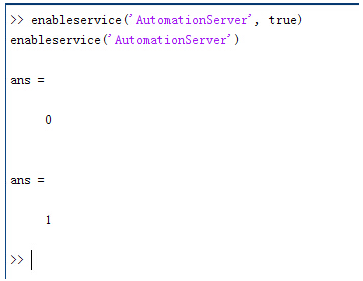
�,1e\��}�^ �N�;|:Ks#! 配置:在执行调用之前,我们需要在Matlab命令行窗口输入如下命令:
�o56Ul���N enableservice('AutomationServer', true)
S�FkB,)Z N enableservice('AutomationServer')
;4Wz�0�suf  �0 ~^�l*�
 结果输出为1,这种操作方式保证了当前的Matlab实体可以用于
通信。
=E�QaZ8k� n>�L24��rL 在winwrp界面,为增加和使用Matlab类型的目录库,我们需要如下步骤:
Sp�A�-E/el 1. 在FRED脚本编辑界面找到参考.
J_}Rs�p ED 2. 找到Matlab Automation Server Type Library
?�atH��ZLF 3. 将名字改为MLAPP
qL2Sv(A Z! S�h��;Z\nj <gLq�?~e|A 在Matlab里面有两种常用的数据发送选项PutWorkspaceData 及PutFullMatrix,PutWorkspaceData适用于存储一般的数据在工作区,并赋予其为变量,PutFullMatrix试用于复数数据。
2"pFAQBw~i 图 编辑/参考
s#4�Q?<65u 8\BYm|%�aa 7Rl/F1G o} 现在将脚本代码公布如下,此脚本执行如下几个步骤:
rL�23^}+^` 1. 创建Matlab服务器。
V�[^��+l�R 2. 移动探测面对于前一聚焦面的位置。
K0^Tg+U($p 3. 在探测面追迹
光线 rv�RIKc|}l 4. 在探测面计算
照度 �#%{x*y:Ms 5. 使用PutWorkspaceData发送照度数据到Matlab
P�,*yuF|bk 6. 使用PutFullMatrix发送标量场数据到Matlab中
"YoFUfa�Ng 7. 用Matlab画出照度数据
LLU]KZhtY| 8. 在Matlab计算照度平均值
�Nc\��jA�= 9. 返回数据到FRED中
['DYP�-1J� Ji�e=�/:&� 代码分享:
J5L[)�Gd)D &2//�\Qz� Option Explicit
Xp?W�oC �N &.ch�q�P(| Sub Main
U`kO<z�t�k ^w�W{�7Uq> Dim ana As T_ANALYSIS
=�(P�k��7{ Dim move As T_OPERATION
��p.RSH$�] Dim Matlab As MLApp.MLApp
V\P��
.uOI Dim detNode As Long, detSurfNode As Long, anaSurfNode As Long
-5u. �Ix3
Dim raysUsed As Long, nXpx As Long, nYpx As Long
�IiZX�IG4H Dim irrad() As Double, imagData() As Double, reals() As Double, imags() As Double
:IRQouTf:, Dim z As Double, xMin As Double, xMax As Double, yMin As Double, yMax As Double
W�&p� f%?� Dim meanVal As Variant
UdK�+,k~m/ t`G<}�t�� Set Matlab = CreateObject("Matlab.Application")
EE,C@d!*k7 i�/aj;�t�� ClearOutputWindow
P�o7o�o�9d H5��/�w!y@ 'Find the node numbers for the entities being used.
�,'a[�1RN detNode = FindFullName("Geometry.Screen")
41��#YtZ�� detSurfNode = FindFullName("Geometry.Screen.Surf 1")
y2:�Bv�2�} anaSurfNode = FindFullName("Analysis Surface(s).Analysis 1")
,�%$�Cfu Bs';!�,��= 'Load the properties of the analysis surface being used.
I�vJ5J�&! LoadAnalysis anaSurfNode, ana
~09k��IO) ��ucX!6)Op 'Move the detector custom element to the desired z position.
Z1�sRLk�R^ z = 50
K�Y�C�<*1k GetOperation detNode,1,move
3S���s)i7� move.Type = "Shift"
A"S�p�7M[J move.val3 = z
`V�=F>s$W� SetOperation detNode,1,move
~NB�lJULS� Print "New screen position, z = " &z
Bt�(U,n�FB -MuKeCg��i 'Update the model and trace rays.
VNHt ]E�wj EnableTextPrinting (False)
�`(VVb�@:o Update
L]�3g�H�q DeleteRays
]6;oS-4gu? TraceCreateDraw
x_��OZdI� EnableTextPrinting (True)
g#r,u5<�*? 7�-2,|(X�g 'Calculate the irradiance for rays on the detector surface.
r)Fd�3)e � raysUsed = Irradiance( detSurfNode, -1, ana, irrad )
�G������ ; Print raysUsed & " rays were included in the irradiance calculation.
?jH�u�,��� C0�-,�<X�� 'When using real number data to send to MATLAB, it is simplest to use PutWorkspaceData.
v\Ed�f;�(� Matlab.PutWorkspaceData("irradiance_pwd","base",irrad)
Dt
�Ry%fA_ �EBx!q8zz 'PutFullMatrix is more useful when actually having complex data such as with
TM0�DR'.� 'scalar wavefield, for example. Note that the scalarfield array in MATLAB
e|M�w9D�IW 'is a complex valued array.
~RIa),GVX� raysUsed = ScalarField ( detSurfNode, -1, ana, reals, imags )
-14~f)%NQ* Matlab.PutFullMatrix("scalarfield","base", reals, imags )
k*�o>ZpjNH Print raysUsed & " rays were included in the scalar field calculation."
%lqrq<Xn�� 8L�h�[>|~= 'Calculate plot characteristics from the T_ANALYSIS structure. This information is used
z[*Y%o8-r� 'to customize the plot figure.
mcLxX'c6<h xMin = ana.posX+ana.AcellX*(ana.Amin-0.5)
W�kSv@��Y, xMax = ana.posX+ana.AcellX*(ana.Amax+0.5)
[K#pU:�lTH yMin = ana.posY+ana.BcellY*(ana.Bmin-0.5)
�
!AFii:#� yMax = ana.posY+ana.BcellY*(ana.Bmax+0.5)
A�=l1_8,`h nXpx = ana.Amax-ana.Amin+1
Gdt�R ��/1 nYpx = ana.Bmax-ana.Bmin+1
*}Nh7�>d(� W;ADc�2#) 'Plot the data in Matlab with some parameters calculated from the T_ANALYSIS
nWsR;~�pK 'structure. Set the axes labels, title, colorbar and plot view.
�ah|`),o(k Matlab.Execute( "figure; surf(linspace("&xMin &","&xMax &","&nXpx &"),linspace("& yMin &"," & yMax & "," & nYpx & "),irradiance_pwd, 'EdgeColor', 'None');" )
&1M#;rE;D# Matlab.Execute( "xlabel('X Position (" & GetUnits() & ")')" ) : Matlab.Execute( "ylabel('Y Position (" & GetUnits() & ")')" ) : Matlab.Execute( "zLabel( 'Irradiance' )" )
J�ec�<1|
Matlab.Execute( "title('Detector Irradiance')" )
0]MI�*s>&� Matlab.Execute( "colorbar" )
Aj "SSX�!L Matlab.Execute( "view(2)" )
CQ^�I;[=d� Print ""
>&l{��_b\k Print "Matlab figure plotted..."
C5&+�1V�rP vH/�Y�]Am� 'Have Matlab calculate and return the mean value.
�of>}fJ�_p Matlab.Execute( "irrad = mean(mean(irradiance_pwd));" )
/�<it��2=� Matlab.GetWorkspaceData( "irrad", "base", meanVal )
VIg=|�Oe), Print "The mean irradiance value calculated by Matlab is: " & meanVal
*&vi3#ur�� h��sHtLH+@ 'Release resources
=�*Y=u6��? Set Matlab = Nothing
��XaR(�~2� �{p��M��3f End Sub
Cswa5�l`af �["XS|"D�M 最后在Matlab画图如下:
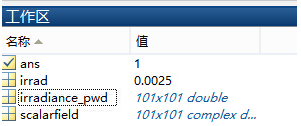
ff<a�d�l-� @d_;p�<�\l 并在工作区保存了数据:
p="K4E8~H�  6HxZS+],�c
 并返回平均值:
�H\ONv=}7I ?8aPd��"�x 与FRED中计算的照度图对比:
}*3#*y� �" Q�E%|8UF�Y 例:
<n|.Z-gF�\ Cd51.�Sk(l 此例
系统数据,可按照此数据建立
模型 W5a>6u=g, X]A�b�Bzy� 系统数据
NzuH&o]�[� |�4u?Q+k%% U&<�w{c�uA 光源数据:
T�r�wk�9 + Type: Laser Beam(Gaussian 00 mode)
�Rhil]�|a/ Beam size: 5;
Mv^�G%z�g2 Grid size: 12;
rkC6���-9V Sample pts: 100;
+yYSp�8�> 相干光;
1$��a�dX�� 波长0.5876微米,
{qkd63��X� 距离原点沿着Z轴负方向25mm。
{uuvgF���C w-(^w�9_�e 对于执行代码,如果想保存图片,请在开始之前一定要执行如下代码:
O.~@V(7ah� enableservice('AutomationServer', true)
q�v���hol� enableservice('AutomationServer')