-
UID:317649
-
- 注册时间2020-06-19
- 最后登录2026-09-08
- 在线时间1983小时
-
-
访问TA的空间加好友用道具

|
简介:FRED作为COM组件可以实现与Excel、VB、Matlab等调用来完成庞大的计算任务或画图,本文的目的是通过运行一个案例来实现与Matlab的相互调用,在此我们需要借助脚本来完成,此脚本为视为通用型脚本。 k|l5"&K~. z�=[l.Af_� 配置:在执行调用之前,我们需要在Matlab命令行窗口输入如下命令: ^�}tL�nF enableservice('AutomationServer', true) 6g8M7<og9R enableservice('AutomationServer') `{%-*f��^� 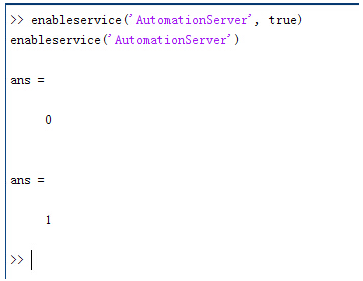 &6�Ns7w6*z 结果输出为1,这种操作方式保证了当前的Matlab实体可以用于通信。 srhFEmgN7) t�+j���IHo 在winwrp界面,为增加和使用Matlab类型的目录库,我们需要如下步骤: ��XS3�{R�� 1. 在FRED脚本编辑界面找到参考. G���I�K�
u 2. 找到Matlab Automation Server Type Library G}�s;J�Jax 3. 将名字改为MLAPP ~U/�8 @g�R Pb3EnNqYbM \�A ;^ UxG 在Matlab里面有两种常用的数据发送选项PutWorkspaceData 及PutFullMatrix,PutWorkspaceData适用于存储一般的数据在工作区,并赋予其为变量,PutFullMatrix试用于复数数据。 x{~_/;\p�3 j_(?=7Y3�g &6�Ns7w6*z 结果输出为1,这种操作方式保证了当前的Matlab实体可以用于通信。 srhFEmgN7) t�+j���IHo 在winwrp界面,为增加和使用Matlab类型的目录库,我们需要如下步骤: ��XS3�{R�� 1. 在FRED脚本编辑界面找到参考. G���I�K�
u 2. 找到Matlab Automation Server Type Library G}�s;J�Jax 3. 将名字改为MLAPP ~U/�8 @g�R Pb3EnNqYbM \�A ;^ UxG 在Matlab里面有两种常用的数据发送选项PutWorkspaceData 及PutFullMatrix,PutWorkspaceData适用于存储一般的数据在工作区,并赋予其为变量,PutFullMatrix试用于复数数据。 x{~_/;\p�3 j_(?=7Y3�g 图 编辑/参考 R2SBhs,+R 8b�{�U
tT 现在将脚本代码公布如下,此脚本执行如下几个步骤: hl*��MUD�, 1. 创建Matlab服务器。 (2cGHYU3N< 2. 移动探测面对于前一聚焦面的位置。 b�d.j,4^�� 3. 在探测面追迹光线 hJ<:-u+yk} 4. 在探测面计算照度 B%)zGT�p6 5. 使用PutWorkspaceData发送照度数据到Matlab _d�Jp
�3D� 6. 使用PutFullMatrix发送标量场数据到Matlab中 j`�{��f�B} 7. 用Matlab画出照度数据 j�-j'ph�K 8. 在Matlab计算照度平均值 �rA[�n�UJ, 9. 返回数据到FRED中 Io2��,% !D 5s#R`o��%Z 代码分享: CgN]dx�*�` YmZC?x_{M2 Option Explicit pb~P�s#"Zg z9I1RX�V� Sub Main t;��h+Cf4� �PpW
A
f\ Dim ana As T_ANALYSIS ��P>.Y)$`r Dim move As T_OPERATION #W_i{�bdO� Dim Matlab As MLApp.MLApp �XSD"/_�xD Dim detNode As Long, detSurfNode As Long, anaSurfNode As Long 58qa�A\i�w Dim raysUsed As Long, nXpx As Long, nYpx As Long >3<&V{�<�K Dim irrad() As Double, imagData() As Double, reals() As Double, imags() As Double "vv$%�^� Dim z As Double, xMin As Double, xMax As Double, yMin As Double, yMax As Double M4R%Gr,L�a Dim meanVal As Variant qxRT1B]{Wx �D W�sCYo� Set Matlab = CreateObject("Matlab.Application") YCt�Ie�q%� ,oC=�{^l{� ClearOutputWindow 8''�9�@�xz �YhEiN�. ~ 'Find the node numbers for the entities being used. 1!K�!o��Y� detNode = FindFullName("Geometry.Screen") 'SsPx&)l� detSurfNode = FindFullName("Geometry.Screen.Surf 1") F�R�b&@(; anaSurfNode = FindFullName("Analysis Surface(s).Analysis 1") r�!"CH5d�T �L%TxP6z4A 'Load the properties of the analysis surface being used. V�2�2q*/iV LoadAnalysis anaSurfNode, ana L&+% Wd~ �I�|V�k., 'Move the detector custom element to the desired z position. �qp�luk!� z = 50 �iuv�tj]/ GetOperation detNode,1,move XHU�<4l:kl move.Type = "Shift" �l|4xKBCV] move.val3 = z z�:0-aDe�M SetOperation detNode,1,move �8 /:X&
& Print "New screen position, z = " &z 3Yn:f�sy�� q���g�) Af 'Update the model and trace rays. Dx9$H++6$X EnableTextPrinting (False) ^EnN�bF�I� Update ��B�aNU�}@ DeleteRays �Sn�{aH�H� TraceCreateDraw l4R<`b\�Jt EnableTextPrinting (True) iKR8^sj�7S 3j�[w
-Lfp 'Calculate the irradiance for rays on the detector surface. p,_6�jd�z raysUsed = Irradiance( detSurfNode, -1, ana, irrad ) Oc�^6u��� Print raysUsed & " rays were included in the irradiance calculation. 4Gm�SG��,] -f-�O�2G�= 'When using real number data to send to MATLAB, it is simplest to use PutWorkspaceData. uI�VTs�9\� Matlab.PutWorkspaceData("irradiance_pwd","base",irrad) �'@3�a,pl� Q6s5#7h'"
'PutFullMatrix is more useful when actually having complex data such as with E��@\�d<c. 'scalar wavefield, for example. Note that the scalarfield array in MATLAB Z�7m��GC`> 'is a complex valued array. y� \mu�tm raysUsed = ScalarField ( detSurfNode, -1, ana, reals, imags ) �USHlb#�*� Matlab.PutFullMatrix("scalarfield","base", reals, imags ) YU�P%K!k�� Print raysUsed & " rays were included in the scalar field calculation." {�="Su{i}} ;r�0|_�mnf 'Calculate plot characteristics from the T_ANALYSIS structure. This information is used A*-]J=:E { 'to customize the plot figure. �rU2YMg�hE xMin = ana.posX+ana.AcellX*(ana.Amin-0.5) !#��_h2��a xMax = ana.posX+ana.AcellX*(ana.Amax+0.5) L*SSv
wSL yMin = ana.posY+ana.BcellY*(ana.Bmin-0.5) l�&e�5_]+% yMax = ana.posY+ana.BcellY*(ana.Bmax+0.5) i_j�ax)m�% nXpx = ana.Amax-ana.Amin+1 �H�L}�sqcp nYpx = ana.Bmax-ana.Bmin+1 E'Fv *UA�� ~|0F?~eR7� 'Plot the data in Matlab with some parameters calculated from the T_ANALYSIS c�"Q�kE*�� 'structure. Set the axes labels, title, colorbar and plot view. X+'^�S��p Matlab.Execute( "figure; surf(linspace("&xMin &","&xMax &","&nXpx &"),linspace("& yMin &"," & yMax & "," & nYpx & "),irradiance_pwd, 'EdgeColor', 'None');" ) u+I r�:��k Matlab.Execute( "xlabel('X Position (" & GetUnits() & ")')" ) : Matlab.Execute( "ylabel('Y Position (" & GetUnits() & ")')" ) : Matlab.Execute( "zLabel( 'Irradiance' )" ) n���'0�$>Q Matlab.Execute( "title('Detector Irradiance')" ) ~_# Y,)S!z Matlab.Execute( "colorbar" ) N c&i) q�h Matlab.Execute( "view(2)" ) �]Lb�?#S� Print "" p'uqh
e �X Print "Matlab figure plotted..." 9wDB�C�~. �c],frhmyd 'Have Matlab calculate and return the mean value. J�4�*:.8Ki Matlab.Execute( "irrad = mean(mean(irradiance_pwd));" ) BC$;b>IUA Matlab.GetWorkspaceData( "irrad", "base", meanVal ) I[�cV�"BDa Print "The mean irradiance value calculated by Matlab is: " & meanVal *]�E7}b�qb 4/-))�F�&s 'Release resources #?b^�B~ #� Set Matlab = Nothing w�$��U�/;C foP>w4p�B� End Sub \+�e�vZ{Pu sk�C|io-Zv 最后在Matlab画图如下: >�b!X&J�U� LGo@F;!n� 并在工作区保存了数据: A �4W��� tci�%=3,)� 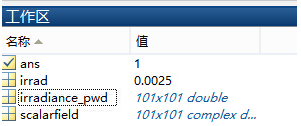 Kn!�0S<ssR Kn!�0S<ssR
Jq+$�_U�qd 与FRED中计算的照度图对比: �� ��L@k;L eV�{�FcJha 例: $b�i�_i|?� 2�dd:�5�L, 此例系统数据,可按照此数据建立模型 _{Q�?VQvZ�
,w�b|?��>Y 系统数据 �v(�Zi;?c�
yzM+28}L<I gt �t��$O� 光源数据: N�;`[R�>Z~ Type: Laser Beam(Gaussian 00 mode) g0:4z��eL Beam size: 5; ";S*[d.2tA Grid size: 12; ch,Zk )y:_ Sample pts: 100; N>nvt.`�P� 相干光; ?lwQne8/�� 波长0.5876微米, Uh�|__DUkh 距离原点沿着Z轴负方向25mm。 kFI�B lP�V :rs\ydDUF� 对于执行代码,如果想保存图片,请在开始之前一定要执行如下代码: .��dKRIF�o enableservice('AutomationServer', true) �)D@n?qbG enableservice('AutomationServer') h3d\MYO)�B
|


