-
UID:317649
-
- 注册时间2020-06-19
- 最后登录2026-07-24
- 在线时间1977小时
-
-
访问TA的空间加好友用道具

|
简介:FRED作为COM组件可以实现与Excel、VB、Matlab等调用来完成庞大的计算任务或画图,本文的目的是通过运行一个案例来实现与Matlab的相互调用,在此我们需要借助脚本来完成,此脚本为视为通用型脚本。 .#( �v�x;� �i~';�1
.g 配置:在执行调用之前,我们需要在Matlab命令行窗口输入如下命令: T\l`Y�-�vu enableservice('AutomationServer', true) (]�]hSkE�� enableservice('AutomationServer') �$���.�`o
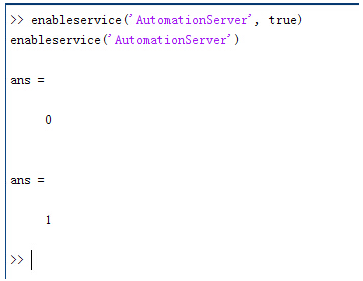 K%z!�#RyJ4 结果输出为1,这种操作方式保证了当前的Matlab实体可以用于通信。 ?�N�Mk��|+ p�<fC��GU� 在winwrp界面,为增加和使用Matlab类型的目录库,我们需要如下步骤: xC`!uPk/pL 1. 在FRED脚本编辑界面找到参考. :3�3@y%>L� 2. 找到Matlab Automation Server Type Library �H>TO8;5(� 3. 将名字改为MLAPP f[o�~�d`�z 94tfR$W;�- As,�`��($= 在Matlab里面有两种常用的数据发送选项PutWorkspaceData 及PutFullMatrix,PutWorkspaceData适用于存储一般的数据在工作区,并赋予其为变量,PutFullMatrix试用于复数数据。 <`n�ShP>vl &L8�RL�SfX K%z!�#RyJ4 结果输出为1,这种操作方式保证了当前的Matlab实体可以用于通信。 ?�N�Mk��|+ p�<fC��GU� 在winwrp界面,为增加和使用Matlab类型的目录库,我们需要如下步骤: xC`!uPk/pL 1. 在FRED脚本编辑界面找到参考. :3�3@y%>L� 2. 找到Matlab Automation Server Type Library �H>TO8;5(� 3. 将名字改为MLAPP f[o�~�d`�z 94tfR$W;�- As,�`��($= 在Matlab里面有两种常用的数据发送选项PutWorkspaceData 及PutFullMatrix,PutWorkspaceData适用于存储一般的数据在工作区,并赋予其为变量,PutFullMatrix试用于复数数据。 <`n�ShP>vl &L8�RL�SfX 图 编辑/参考 .6wPpLG?{ }5
rR^ryA� 现在将脚本代码公布如下,此脚本执行如下几个步骤: 2zC4nF)�>O 1. 创建Matlab服务器。 iWCYK7c@.- 2. 移动探测面对于前一聚焦面的位置。 �b��mG`:�_ 3. 在探测面追迹光线 tguB@�,�O� 4. 在探测面计算照度 3TwjC:Yhv2 5. 使用PutWorkspaceData发送照度数据到Matlab \|HtE(uCM1 6. 使用PutFullMatrix发送标量场数据到Matlab中 ~,)jZ-f�w 7. 用Matlab画出照度数据 sfXF�h���� 8. 在Matlab计算照度平均值 Y���mV/[{� 9. 返回数据到FRED中 a�Xe&c^A�R �OUB�Gb�ld 代码分享: &=��@{�`2& &_�L��@hsm Option Explicit �!Tnjh�a*� &da=hc�,>% Sub Main "Z@P�&�j�l qDdO-fP�ev Dim ana As T_ANALYSIS Y�%
�iqS�Y Dim move As T_OPERATION 5K�zt8Tv[� Dim Matlab As MLApp.MLApp jq�~`rE
h9 Dim detNode As Long, detSurfNode As Long, anaSurfNode As Long ����~�~>m� Dim raysUsed As Long, nXpx As Long, nYpx As Long [:X@|,1V!L Dim irrad() As Double, imagData() As Double, reals() As Double, imags() As Double -@N-i$!;�J Dim z As Double, xMin As Double, xMax As Double, yMin As Double, yMax As Double i~�u4v3�r= Dim meanVal As Variant w.m8SvS&b� �Wb}-H�-�O Set Matlab = CreateObject("Matlab.Application") aT0~C�.v�T K6v~!�iiK$ ClearOutputWindow ��_�U~�R�� �<9�@�n��/ 'Find the node numbers for the entities being used. SE�gw!2�H� detNode = FindFullName("Geometry.Screen") �R��C_Pj)� detSurfNode = FindFullName("Geometry.Screen.Surf 1") Jm4uj�&}�3 anaSurfNode = FindFullName("Analysis Surface(s).Analysis 1") �KsUL�QJ#, /z�IG5RK�> 'Load the properties of the analysis surface being used. mEY#QN[�eq LoadAnalysis anaSurfNode, ana 5IU!�BQ�U� !9d7wP�UFr 'Move the detector custom element to the desired z position. �J*B-*6O44 z = 50 S`-I-VS=L GetOperation detNode,1,move O,%UNjx9�K move.Type = "Shift" u�aIAVBRcS move.val3 = z PZ��]�t�l� SetOperation detNode,1,move {~a�pY,�3 Print "New screen position, z = " &z �Z �%�pc�" v4�7�' �dC 'Update the model and trace rays. �_T)y5/[� EnableTextPrinting (False) {�K|?�i9�K Update HI5NWd�fRl DeleteRays x1:mT�[[$� TraceCreateDraw �*;�Kp�"�j EnableTextPrinting (True) kff N�0(MR �-ssb�|��r 'Calculate the irradiance for rays on the detector surface. P& 1$SWNyW raysUsed = Irradiance( detSurfNode, -1, ana, irrad ) hb3n-
�r�O Print raysUsed & " rays were included in the irradiance calculation. zg�jg#|� $�#=d�@Nw_ 'When using real number data to send to MATLAB, it is simplest to use PutWorkspaceData. QSaDa�@OV Matlab.PutWorkspaceData("irradiance_pwd","base",irrad) VxY]0&�s�q 4X=VNORlU0 'PutFullMatrix is more useful when actually having complex data such as with m=�}h7&5p 'scalar wavefield, for example. Note that the scalarfield array in MATLAB *~8F.c���x 'is a complex valued array. [Qs�`@�u<% raysUsed = ScalarField ( detSurfNode, -1, ana, reals, imags ) �G�2��`YZ\ Matlab.PutFullMatrix("scalarfield","base", reals, imags ) TQB�)
A9�� Print raysUsed & " rays were included in the scalar field calculation." YK�e�&P�h. ~�<k>07��� 'Calculate plot characteristics from the T_ANALYSIS structure. This information is used hWly8B[�I� 'to customize the plot figure. i�9� �aR#� xMin = ana.posX+ana.AcellX*(ana.Amin-0.5) x(c+�~4:_M xMax = ana.posX+ana.AcellX*(ana.Amax+0.5) �99O����ZK yMin = ana.posY+ana.BcellY*(ana.Bmin-0.5) M7B�pOmK�' yMax = ana.posY+ana.BcellY*(ana.Bmax+0.5) O/eZ1�Y�AC nXpx = ana.Amax-ana.Amin+1 W'6D�w��V| nYpx = ana.Bmax-ana.Bmin+1 �r�Qv5u�oD �>3�3��=0< 'Plot the data in Matlab with some parameters calculated from the T_ANALYSIS ;Am3�eJa*- 'structure. Set the axes labels, title, colorbar and plot view. �QN8+Uj/zx Matlab.Execute( "figure; surf(linspace("&xMin &","&xMax &","&nXpx &"),linspace("& yMin &"," & yMax & "," & nYpx & "),irradiance_pwd, 'EdgeColor', 'None');" ) �fTEZ@��#p Matlab.Execute( "xlabel('X Position (" & GetUnits() & ")')" ) : Matlab.Execute( "ylabel('Y Position (" & GetUnits() & ")')" ) : Matlab.Execute( "zLabel( 'Irradiance' )" ) L����v+{@) Matlab.Execute( "title('Detector Irradiance')" ) k�_�t|)
J Matlab.Execute( "colorbar" ) C).\ J !� Matlab.Execute( "view(2)" ) H:~�bWd'iz Print "" �fV�+a0�=Z Print "Matlab figure plotted..." (H:c8�0/V� ")�8l'^Mq2 'Have Matlab calculate and return the mean value. ��q%,86A>� Matlab.Execute( "irrad = mean(mean(irradiance_pwd));" ) �.�5 E)d�U Matlab.GetWorkspaceData( "irrad", "base", meanVal ) r
(m3"Xu6O Print "The mean irradiance value calculated by Matlab is: " & meanVal -��O� &>HA >|S�@tw��y 'Release resources EUS�M�4djL Set Matlab = Nothing j+3��\I��> �tE�0{ae�� End Sub �,?�LE��5] e\~nq�KCb� 最后在Matlab画图如下: �-�+F,L8 M�XW1����: 并在工作区保存了数据: d�g.�1{6HM =.s0"[% �� 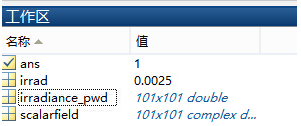 Um/l{:S��� Um/l{:S���
*Y8�5ev��q 与FRED中计算的照度图对比: �l]wf�L�;u ;tQ�c{8O6L 例: u�Wx<J3~q. qBF�|' .$^ 此例系统数据,可按照此数据建立模型 ��x��((��u
8�}yrs�F�# 系统数据 \asn^V@"zz
w�H�bm�K� $mK�;{9Z
光源数据: �6}Y==GP�t Type: Laser Beam(Gaussian 00 mode) �0;x&\x7K� Beam size: 5; _'!q�Ot7�D Grid size: 12; Wp�f~Ji6|| Sample pts: 100; v�cW(?��4e 相干光; ��5�~px��u 波长0.5876微米, �Qc���W�g� 距离原点沿着Z轴负方向25mm。 �'g�<"@SS+ :UT�\L2 q= 对于执行代码,如果想保存图片,请在开始之前一定要执行如下代码: NcbW�"Q�v3 enableservice('AutomationServer', true) �J#:`�'eEG enableservice('AutomationServer') ##By!F��TP
|


