-
UID:317649
-
- 注册时间2020-06-19
- 最后登录2025-12-12
- 在线时间1894小时
-
-
访问TA的空间加好友用道具

|
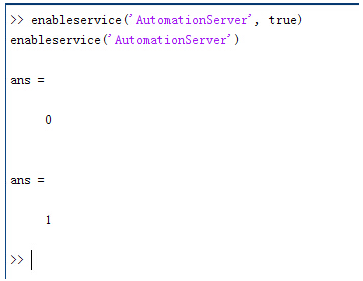
简介:FRED作为COM组件可以实现与Excel、VB、Matlab等调用来完成庞大的计算任务或画图,本文的目的是通过运行一个案例来实现与Matlab的相互调用,在此我们需要借助脚本来完成,此脚本为视为通用型脚本。 ]$Ky�ZHj�{ �BR�8z%�R� 配置:在执行调用之前,我们需要在Matlab命令行窗口输入如下命令: }N#jA �yp! enableservice('AutomationServer', true) >#Y8#-$z�c enableservice('AutomationServer') �I�5wf|wB-  A 7�'dD$9 结果输出为1,这种操作方式保证了当前的Matlab实体可以用于通信。 $^�INl0Pg� eA�$9)K1GO 在winwrp界面,为增加和使用Matlab类型的目录库,我们需要如下步骤: O`g44LW2�n 1. 在FRED脚本编辑界面找到参考. |#^u�%#'[2 2. 找到Matlab Automation Server Type Library h2`W�~g�_� 3. 将名字改为MLAPP RvZi����%) |F�-��_YR Bbz#$�M!�: 在Matlab里面有两种常用的数据发送选项PutWorkspaceData 及PutFullMatrix,PutWorkspaceData适用于存储一般的数据在工作区,并赋予其为变量,PutFullMatrix试用于复数数据。 >7!4�o�9)c f7�)}A/$4+ A 7�'dD$9 结果输出为1,这种操作方式保证了当前的Matlab实体可以用于通信。 $^�INl0Pg� eA�$9)K1GO 在winwrp界面,为增加和使用Matlab类型的目录库,我们需要如下步骤: O`g44LW2�n 1. 在FRED脚本编辑界面找到参考. |#^u�%#'[2 2. 找到Matlab Automation Server Type Library h2`W�~g�_� 3. 将名字改为MLAPP RvZi����%) |F�-��_YR Bbz#$�M!�: 在Matlab里面有两种常用的数据发送选项PutWorkspaceData 及PutFullMatrix,PutWorkspaceData适用于存储一般的数据在工作区,并赋予其为变量,PutFullMatrix试用于复数数据。 >7!4�o�9)c f7�)}A/$4+ 图 编辑/参考 � 4�>uz'j< J��t43+�]� 现在将脚本代码公布如下,此脚本执行如下几个步骤: mLd=�+&�M 1. 创建Matlab服务器。 _&D�I_'5q+ 2. 移动探测面对于前一聚焦面的位置。 �1u:OzyJy� 3. 在探测面追迹光线 MlkT�rKdGi 4. 在探测面计算照度 { ���.B��^ 5. 使用PutWorkspaceData发送照度数据到Matlab �"(F>?�pq� 6. 使用PutFullMatrix发送标量场数据到Matlab中 ^�6�Q�(h�e 7. 用Matlab画出照度数据 "�pa5+N&2- 8. 在Matlab计算照度平均值 R��44�J�K� 9. 返回数据到FRED中 ��@O�ZW1�p #�[��vmS�� 代码分享: 4xk�'R�[v� 36,qh.LK�n Option Explicit Qf�6]qJa| n�mn$$=�~) Sub Main �CN#`�m]l. ;+>-u�PT/1 Dim ana As T_ANALYSIS oL1�m<cQo9 Dim move As T_OPERATION ��B=�%cXW, Dim Matlab As MLApp.MLApp \m��1r(*Ar Dim detNode As Long, detSurfNode As Long, anaSurfNode As Long S)�Sv4Q�m� Dim raysUsed As Long, nXpx As Long, nYpx As Long 7G.IGXK$� Dim irrad() As Double, imagData() As Double, reals() As Double, imags() As Double g05:��A0X# Dim z As Double, xMin As Double, xMax As Double, yMin As Double, yMax As Double ��kL�U$8L� Dim meanVal As Variant ��1@"�e�eR ��T3u�%V_� Set Matlab = CreateObject("Matlab.Application") iK#�5H��W{ � &~�:b��& ClearOutputWindow M&Sjo' ( . _Ft4�F`p�M 'Find the node numbers for the entities being used. fLA!oeq{&} detNode = FindFullName("Geometry.Screen") MLtfi{;L�H detSurfNode = FindFullName("Geometry.Screen.Surf 1") 4.�$��<o/M anaSurfNode = FindFullName("Analysis Surface(s).Analysis 1") &, hhH_W�� F-k3�'eyY 'Load the properties of the analysis surface being used. �Li�(��}_ LoadAnalysis anaSurfNode, ana u7ZSs-LuHw ;g?oU�"Y�M 'Move the detector custom element to the desired z position. ��/B�.\��6 z = 50 �/��@g�D
8 GetOperation detNode,1,move �F<�Js"�z+ move.Type = "Shift" �A1Ia9@=Mf move.val3 = z 1`�)ie%�= SetOperation detNode,1,move tPIT+1.�]z Print "New screen position, z = " &z ~��J^Gzl� d@#!�,P5�` 'Update the model and trace rays. 2Vas�`/~u~ EnableTextPrinting (False) ��kngkG|du Update TUHC[#Vb?� DeleteRays AP'��Uc��A TraceCreateDraw 7t�P?([o%F EnableTextPrinting (True) Qz2Y�w `�� bq/����m?; 'Calculate the irradiance for rays on the detector surface. ��YHAh�F@& raysUsed = Irradiance( detSurfNode, -1, ana, irrad ) Y�!�c�
RzQ Print raysUsed & " rays were included in the irradiance calculation. yoGe^ga�r� �mYJ%gdTpo 'When using real number data to send to MATLAB, it is simplest to use PutWorkspaceData. ,#hS#?t�� Matlab.PutWorkspaceData("irradiance_pwd","base",irrad) 3 �G�mU$w� 6S�)$wj*�w 'PutFullMatrix is more useful when actually having complex data such as with ~B;kFdcVXn 'scalar wavefield, for example. Note that the scalarfield array in MATLAB ^\Tde�*48� 'is a complex valued array. J�@�PwN^`� raysUsed = ScalarField ( detSurfNode, -1, ana, reals, imags ) 4�|YCBXW�h Matlab.PutFullMatrix("scalarfield","base", reals, imags ) -CtLL��_�I Print raysUsed & " rays were included in the scalar field calculation." ��:#�s�6�, 8,=N~(pd�` 'Calculate plot characteristics from the T_ANALYSIS structure. This information is used �jq:FDyOAW 'to customize the plot figure. (JHzwI8��+ xMin = ana.posX+ana.AcellX*(ana.Amin-0.5) .lA�q��D�- xMax = ana.posX+ana.AcellX*(ana.Amax+0.5) $�"1Unu&�P yMin = ana.posY+ana.BcellY*(ana.Bmin-0.5) f�4YcZyBGv yMax = ana.posY+ana.BcellY*(ana.Bmax+0.5) [[�2Z�cz:� nXpx = ana.Amax-ana.Amin+1 9�g3e( z�@ nYpx = ana.Bmax-ana.Bmin+1 �!
7A _UA8 t��eH�.e!S 'Plot the data in Matlab with some parameters calculated from the T_ANALYSIS @[h)M3DFd� 'structure. Set the axes labels, title, colorbar and plot view. F^.w:�ad9< Matlab.Execute( "figure; surf(linspace("&xMin &","&xMax &","&nXpx &"),linspace("& yMin &"," & yMax & "," & nYpx & "),irradiance_pwd, 'EdgeColor', 'None');" ) (jd)sf6Tj[ Matlab.Execute( "xlabel('X Position (" & GetUnits() & ")')" ) : Matlab.Execute( "ylabel('Y Position (" & GetUnits() & ")')" ) : Matlab.Execute( "zLabel( 'Irradiance' )" ) !2R~�/R��g Matlab.Execute( "title('Detector Irradiance')" ) d
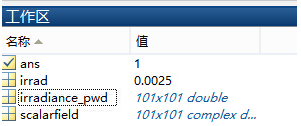
4w+5H"�u Matlab.Execute( "colorbar" ) )'3(�=F$+l Matlab.Execute( "view(2)" ) ]Q1�?�Ox:' Print "" <wWZ]P�2]� Print "Matlab figure plotted..." d��Zc�RLLR �DjY&)oce( 'Have Matlab calculate and return the mean value. ��-x)��Oo` Matlab.Execute( "irrad = mean(mean(irradiance_pwd));" ) 1�2q�X[39/ Matlab.GetWorkspaceData( "irrad", "base", meanVal ) >]K:�l�J]l Print "The mean irradiance value calculated by Matlab is: " & meanVal `>KB8SY:qK �cd��iDfiE 'Release resources .|W0�B�+Z8 Set Matlab = Nothing CeQL8��yJ; Ks'ms�S�MC End Sub �GcN[bH(�@ �Q��Y2/mtI 最后在Matlab画图如下: le60b�@2G0 VqG�m�Z|+8 并在工作区保存了数据: 1AMxZ�� (e ln4gkm<�]t  P`r@<c�gb= P`r@<c�gb=
%N��+��8K� 与FRED中计算的照度图对比: }dc�XuX4{r �Bh3N6j+$d 例: qQK0�s*�^W I~Y��1DP)R 此例系统数据,可按照此数据建立模型 ^ �[FK�<�9
�jZwv��!-: 系统数据 3h�t>eaHi�
OXu*w�l(z F�vpaU\D� 光源数据: %c+`�8 wj Type: Laser Beam(Gaussian 00 mode) 7>�
�~70 Beam size: 5; U�Q]W��BS\ Grid size: 12; �,36AR|IO) Sample pts: 100; w�_�zUA'n+ 相干光; 1^&��qlnqH 波长0.5876微米, �I�
ACpUB 距离原点沿着Z轴负方向25mm。 �t6-He��~� <�X��@XbM 对于执行代码,如果想保存图片,请在开始之前一定要执行如下代码: pc9m��,?�n enableservice('AutomationServer', true) WRa1�VU�&f enableservice('AutomationServer') �udw>{�3>� �udw>{�3>�
|