摘要 X`�k�#/~+0
&W>�%E!�F� 在光学工程中,高效的计算结果很难通过强力光线追迹来获得。使用辐射测量学技术,在很短的时间内,可以有效并准确地执行杂散光,照度均匀性和自发热辐射的计算来追迹必要数量的光线。 -Vj�r�h/�@ �;k,#o��!> 关键字:照明,辐射度量学,光线追迹,杂散光 ��}�FC(Z-g �K5\;'.�9M 1.前言 �7KV0g1�GQ
l�3YS_WBSn 根据MSNtm Encarta(微软公司产品)在线词典,“clever”这个词是一个形容词,意为“展示意志力,敏捷性和创造力”。“trick”这个词是一个名词,意为“一个特殊的、有效或巧妙的技巧,技能或技术”。综上所述,本文的目的是介绍光学工程领域中聪明的和创造性的使用技巧。 )'$'�?��Fn 5?Rzyf�wk| 在光学软件的早期,当开始执行计算时,设计人员和分析师学会了如何高效又富有洞察力的计算。他们必须如此的原因是,在分时享用计算机上进行计算成本很高,而且获取计算机并不总是很方便。此外软件开发人员还没有写出很多如目前的现代软件一样丰富的专门的功能。 �Q::_�i"?c b./MV���z 现代的软件提供了无数种计算选择,这使得很多没有经验的用户相信,每一个问题可以通过按下工具栏上的按钮而得以解决(图1)。这是不正确的! 'w`9l��Iax �B�>�e�},! 图1 “圣杯”界面的发展:一个解决了用户问题的按钮,…不管它是什么问题。
JcW<�<�7R� 有几类问题,仅仅按钮的解决方案是行不通的。这包括杂散光/离轴抑制计算,照明分析问题(特别是源于特定的视角),自发热辐射计算及涉及多光束的干涉分析。这篇论文论述了前三类问题。 ��"jP{m;�p Uc�]s�W�cR 2.杂散光的计算 E~c>L�F_]Q
$1bzs�B|�^ 例如,让我们考虑距离地球特定轨道高度上的传感器的典型杂散光计算案例(图2)。在这种情况下,传感器的视线(LOS)是在地球的边缘之上;LOS与边缘之间的角度通常称为“边缘角”。现在的问题是“到达传感器FPA(焦平面阵列)的杂散光数量是多少?” �5�_Oxl�6# <io�;d$=}� 图2 地球传感器的几何结构(不按比例尺测量)。
�RJ$x�{$r[ 最显而易见的方法是将地球作为发射器(图3)。使用这种技术,用户需要从地球追迹极大数量上的发射光线,并希望一些光线可以到达传感器。假设一些光线确实到达传感器(不太可能!),这些光线由于光学和机械的原因发生散射,而这些散射的光线在FPA中得到积累。在追迹足够数量光线的极限情况下,这种技术将会起作用,但在合理的时间内,对于任何适当数量的光线追迹,光线统计将极其稀少。 kaNK@a=e|/ �aHSl��_[� 图3 强力光线追迹:将地球作为朗伯发射体。
��@-a�M�j� 这个问题显然有它的原因,在于地球的大小和传感器入口处孔径的大小的重大尺寸差异。解决这个问题的传统方法是考虑来自地球的传感器的杂散光特点并且分为两部分来做实验。 Kq�z�QL�u� hixG/%a�O� 传感器的杂散光的特点是方便地包含在一个名为点源透射率(PST)的函数中。虽然有几种对于PST的定义,但是辐照度定义(公式1)是最常见,因为它对例如由次反射镜和支撑结构等等产生的光瞳中的遮光作用不敏感。 �<P�p�W.1w }x?2�t�xuu M�1e��79p<  O|Y~^:�n�y
 图4 在一个离轴角θ上计算PST。
_|s'0F��/t 9�wpV} .�( 图5 地球积分计算的几何结构
rFG_�C��C2 一旦计算完PST,它必须为在特定边缘角和距离地球轨道高度上的扩展立体角积分,为了获得(图5)杂散光等级。地球数学积分表达式为: �)|E�617g ]�O+W+h{] 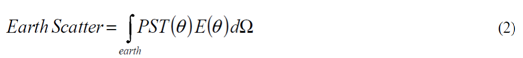 Vae=Yg=�fw
 图6 光源和接受面之间的简单自由空间能量传递关系。
]r(s�0�2 展开为光源-接受面微分(图6) )^LiA�L�h� �T1g�3`7C3 我们注意到两个方程(5)的右手边是相同的,因此 ,HtX�D�~N� 8�;"HM5+� 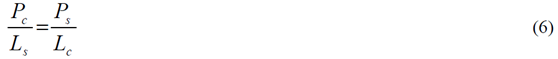 �J� @^Yp�q
  F6gU9�=F1<
��~�+C�Eek 图7 灯箱和灯具的几何结构
-SUK��[<=X 最直接的方法是将灯具视为发射器,就像在先前的例子中地球被作为发射器一样的方法。我们会追迹大量灯具的光线,其中许多将散射出灯箱。在光线追迹的结论中,我们将积累直射光和散射光线到眼睛上。这取决于眼睛相对于灯箱的位置,光线统计将会少的可怜。 v?(z4oOD/> +��D
d�!� 但是我们可以使用相同的技巧:在眼睛处开启单位辐射亮度的光线分布和适当大小的功率(公式7),发射光线到灯箱的立体角,并在灯具处收集灯的能量(图8)。由灯具聚集的功率量再次在数值上等于单位辐射亮度灯具入射到眼睛上的功率。(在实际的灯具中,在整个表面辐射亮度很少是常数。然而这是一个简单的问题:将灯打破为相同的辐射亮度部分,并将公式6逐个部分应用)。 =;~*Y�D(%/ �U%rq(`;�
分析师经常想知道亮度如何随眼睛位置(“眼睛体积”)变化。这种技术非常适用,通过在眼睛位置处设置阵列然后开始反向光线追迹,如图9所示。 g+3_ $qIQ+
^�5rB/�y,� 图8 从眼睛到灯箱/灯具的反向追迹
_�@OS��,A 图9 从眼睛位置(“眼睛体积”)的阵列追迹
�t_w2J�=�2 我们也可以将这种技术应用到镜面反射器和一个弧灯的辐照度计算中(图10)。在这种情况下,目标区域分为很小微分区域;从每个微分区,反向追迹光线到反射器和聚集在模拟弧光源的吸收表面。图11显示了正向追迹和反向追迹的辐照度计算结果。 �dheobD�� Y�T'ol��k� 图10 计算平面上的照度分布
Rw�Uo�sh\W 在此有两个实际问题:计算时间和准确性。在一个复杂的系统中,如果分析师尝试获得增量变化对设计的影响并且想要“实时”地这样做,那么光线追迹时间将会特别多。反向光线可以使计算近乎迭代。此外,因为功率收敛的速度比均匀性要大,那么分析师几乎可以确信结果的准确性,即使只有少数光线从每个微分区到达弧光源。 ��-S�7i'�: <kKuis6��h 图11 两个辐照度的计算的对比:一个使用向前光线追迹而后一个使用反向光线追迹。后者需比前者少53x光线来达到相同的精度水平。
D-LQQ{!�D5 4. 计算自发热辐射 A�$�70!5*� HsK�q/O�yk 在许多应用程序中,长波红外引导头的设计作为一个常见的例子,减少热自辐射意味着减少噪声,从而提高灵敏度。 �m{���f+�! `Gh J)WA<�
自发热辐射简单描述:每个作为朗伯发射器的光学和机械结构辐射能量作为它的温度和辐射率函数。这些释放出的能量就是通过光线追迹进行模拟;当其通过系统传播时,这些光线遵循几何光学的定律。光线(因此他们所代表是热能)聚集在FPA上。 �+h@ZnFp3
Q[)3r��
,D
根据这个计算,大多数软件让用户设定对象的温度和发射率。从统计学的角度来看,这是完全错误的做法!在大多数“真正的”系统中,FPA相对于光学和机械部件朝向非常小的立体角,所以当很多光线追迹时,如果有的话,那么很少到达FPA上(图12)。结果是自发热辐射的错误的估计。 Nr?CZFN��#
��Cs2k�bG_
有一个更有效的但不是最优的方法。直接的或间接的,大多数软件允许用户指定优选的辐射方向,在文献中这些被称为“重要性采用”。使用这种技术,用户指定每个光学和机械组件的重要性方向。在光线追迹中,光线优先散射到这些方向,这样可以非常有效地将光线导向FPA(图13)。这极大的提高了统计,并产生了自发辐射的准确评估。然而在一个由很多结构组件组成的复杂系统,例如“现实生活”中的系统,这中方法做起来繁琐且耗时,特别是如果分析师需要做温度和辐射率工作。 lJdrrR)wg
x27$h�)R0v
图12 主筒自发热辐射强力光线追迹。在这种情况下,发射的光线没有到达FPA。
图13 发射朝着一个重点方向计算更有效率,但设置非常乏味
CbFO9��q��
�z�}F^HQ�1
最好的计算方式是进行热辐射学数学运算。计算自发热辐射(TSE)基本上是一个求和的形式 ��UJ��><B"
'L��Y�N��{
既然热辐射是朗伯型的,那么我们可以用一个等效表达式代替L \%�_s�L�#?
Y�m�D~�&J�
���^�O<@I
在此,ε=发射率,f=黑体积分因子,σ=斯蒂芬-玻尔兹曼常数,T=温度(K)。问题是如何有效地计算Aobject和Ωdetector。 dF7�`V J2�
@H}{?-XyA�
调换光源和接受面的角色(使用公式5),我们可以写为 +wfZFJ:1l
;
�W$.>*O�
注意,探测器Adetector的面积是一个固定的量。有效地计算每个发射对象的立体角,我们调用辐射方程中的对称性: x"A\�Z-xxz
b^A7�R{G7
公式11中,注意,如果我们从L = 1 / π Adetector的探测器发射光线,入射到对象上的功率将在数值上等于其投射的立体角。(回想一下,投射立体角等于Ω/π)。因此,发射探测器功率由下式给出 `��>�=@�Kc
(事实上这是正确的,如果探测器辐射成锥形。如果我们想要辐射到一个矩形体积, �Y$_^f*sFn
那么正确的探测器功率是4/π这么大。) >:h&5@^�j$
f8-~&N�/_R
知道如何有效地计算投射立体角是这项技术的关键;这是第二个“聪明技巧”。因为立体角是不变的,他们只需要计算一次(图14)。 ��uK0�L>��
图14 从FPA反向光线追迹获得准确的投射立体角的值。在大多数情况下,杜瓦窗口是相于探测器最近的限制孔径,我们通常只发射光线到立体角的限制孔径。
xeKm} MN]S
)5fly%�-r)
自发热辐射计算包含在公式10中,这很容易在电子表格中执行(图15)。出于完整性的考虑,最后给出了自发热辐射的方程如下 w$�j�6�!z
%V�fr#j$�=
在此,表达式(Ω/π)是由光线追迹计算得到的投射立体角。 /�Mj|�P�x%
图15使用电子表格(例如Exceltm)计算自发热辐射。列“Incident Power”实际上是投射立体角,列“Contribution”由公式13实现。
y�5�X��FJj
?rziKT5OOC
反向光线追迹计算自发热辐射的优点有很多,包括 �O��S�1f}<
1. 立体角精度由探测器光线追迹的数量决定。 ]2{]TJ��@B
2. 在切合实际的电子表格中,温度和发射率很容易改变。
^CD?�SP"i
3. 没有繁琐的设置时间;设置时间不再是一个模型复杂性的函数。 ���eN`G2eE
4. 探测器上自发热辐射的映射图可以通过将探测器分为微分区域并从每个区域进行光线追迹并对每个区域做和得到。 '��<'5�BeU
�V9��cj��
总结 �,�eSpt�#M
?)��J�e%H�
现代光学软件非常强大且实用,让许多有经验和无经验的用户通过单击工具栏上的一个按钮,完成许多复杂的分析。然而在许多场合,用户需要执行的计算在软件预定义的方式中并非直接可用。在一个恰当的时间内,采用“聪明的技巧”通常是执行这些计算以达到要求的精度唯一的方法。 ]W5p\�(1�g
0Qy��L}y2�
致谢 4��UND;I�&
<U8w#��d�c
作者希望感谢Raytheon公司的David Rock先生,关于如何有效地计算杂散光计算这个话题,感谢与先生的多次问题讨论以及先生耐心的指导。 mQ9shdvt-�


