-
UID:317649
-
- 注册时间2020-06-19
- 最后登录2025-07-11
- 在线时间1813小时
-
-
访问TA的空间加好友用道具

|
沃拉斯顿棱镜偏振器包含两个由单轴晶体构成的直角棱镜,如方解石,它经常用于沃拉斯顿棱镜中。两块单轴晶体是定向的,使得晶轴互相垂直。如下图所示的几何结构,水平偏振光在第一个区域中以非寻常折射率(ne)传播,折射到第二个区域中,以寻常折射率(no)传播。垂直偏振光经过相反的折射,两个偏振态就这样分开了。本文介绍了一个脚本,即wollastonCreator.frs,根据输入到基本对话框中的用户技术参数来创建一个沃拉斯顿棱镜,且允许三个方向上具有不同的尺寸。wollatsonPrismPolarizers.frd这个FRED文件包含两个使用生成器脚本创建的沃拉斯顿棱镜— 一个是基于ThorLabs模型,另一个是基于Edmund光学模型。为了方便起见,沃拉斯顿生成器脚本和双折射材料生成器脚本已作为嵌入式脚本包含在里面。当定义用于沃拉斯顿棱镜偏振器的双折射材料时,双折射材料生成器可能会非常有用。 M�X?UmQ'�� =�=g�L�!e{ 图1. 沃拉斯顿棱镜偏振器的晶轴标记为黑色箭头,水平(x)偏振光向上偏折,垂直(y)偏振方向上下偏折(假定为负单轴晶体no>ne)。 Nd_A8H�,&B FRED中的双折射材料 �AWP�grv�/
SIK�a�DIZ� 在使用双折射材料创建元件之前,理解他们在FRED中如何定义的是很有用的。通过使用“Sampled Birefringent and/or Optically Active Material”作为材料类型,指定若干波长处的寻常和非寻常折射率,单轴晶体的轴向量,我们就定义了一个双折射材料。通常,晶轴方向是一个矢量,该矢量的指向沿着与全局坐标系中非寻常折射率ne相关的方向。当创建一个新的双折射材料时,包含晶轴方向名字或描述是一个好的习惯。当一个双折射材料分配到一个表面时,它是置于该表面的父实体(目标实体)的局部坐标系中。当使用双折射材料创建透镜、反射镜或棱镜时,也是同样的道理。举个例子,如果一个透镜是由双折射方解石制成,且晶体光轴固定在x方向(1 0 0),表面材料的定义是相对于透镜坐标系的。同样的透镜如果经过旋转,它的性能可以保持。注意到与透镜、反射镜或棱镜元件不同,当使用双折射材料定义元件基元时,该材料是停留在全局坐标系中的。FRED中有一个实用工具可以用来修改、检查并记录材料的方向,即“Edit/View GRIN/Birefringent Material Position/Orientation”,通过“Tools”顶部菜单或右键单击对象树中的一个实体就可以访问它。如图2所示,该工具有一个下拉菜单,里面包含双折射或GRIN材料在内的所有表面材料的一个列表。所选材料的坐标系显示在其中,且可以编辑。 )db:jPkw�d
Q`��6hJgyL 图2. 编辑/查看双折射材料位置/方向工具 $G��6kS@A�
脚本 7E#h(bt �j
u^B!�6S�j8 嵌入式脚本使用一个对话框(见图3),提示用户有关棱镜名子、描述、材料和尺寸的信息。第一个材料(双折射材料1)将分配到沃拉斯顿棱镜的第一个区域,并且它的晶轴方向沿着x轴(晶矢[1 0 0])。第二个材料(双折射材料2)应该与第一个是同样的材料,但是晶轴方向沿着y轴(晶矢[0 1 0])。这两种材料一定是“Sampled Birefringent and/or Optically Active Material”类型的。另外,浸液材料也应该指定好。 ��gm�n �b�
r�}s��O},i 63_#*6Pv28 图3. 沃拉斯顿棱镜创建对话框 %Y0�B�PTt$ 该脚本首先生成了所有材料的列表,以及本文中提及的双折射材料,然后从对话框中获取用户的输入并将它们分配给变量。这样就创建了新的自定义元件实体,接着按顺序定义每一个表面。 =cb!2%?�}� d�tTfV.y4w ��LAM{
,?~ 样本模型 @o��*~\E<T
N �3O!8�A_ FRED文件.frd包含了两个沃拉斯顿棱镜模型,由沃拉斯顿棱镜生成器脚本产生。它们都还含有使用布尔复合元件创建的粗糙的模型。为了分析该棱镜,我们定义了多偏振和非偏振光源。除了常规的分析表面,我们也定义了一个定向分析表面。它可以用来运行“Intensity on Polar Grid”分析,来测量正交偏振光束之间的角间距。 It/hXND��` $aB`�A$'hK 图4. 角间距计算 �'p\&Mc_Gu 例:双折射率材料创建 (v
KJyk+Y� KKb�7dZbt< 双折射材料包含o光折射率和e光折射率,FRED中有许多种双折射材料库,但在FRED中均是o光折射率和e光折射率分开存放的,如何放到一起,我们可以使用如下的VB脚本快速创建,新生成的双折射材料的类型为"Sampled Birefringent and/or Optically Active Material"。 �k�Od�pW�� 我们以方解石为例。 B2*>7 kc_s 6�4�'QTF{D 1. 在FRED的树形文件夹中选择Materials/Add Glass catalog Material/Material catalog:Custom auX(�d �-m 在列表中找到CaCO3和 CaCO3_extraorinary,分别选中点击OK。 ujN~l_��4 D|�<_96_m �*G��Y8#Az 2. 可在Materials 树形文件夹下查看CaCO3材料是否已经添加进去? t�9�*e"�QH }�EH��L
}Q 3. 在树形文件夹中选择:Embedded Scripts /Birefringent material creator右键选择“.Run an Embedded script. lq]8zm<\)] _�_s'/�6�u 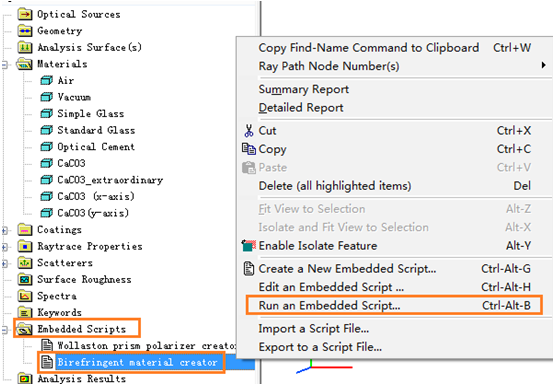 ZZwIB3sNhf ZZwIB3sNhf
axis_z = CDbl(dlg.TextBoxZ) 1'k,�P�;�s
�vDc�&�m��
'Print warning if material of the same name already exists ?D�NeL;�6
Print " " �IZ����.�b
If FindMaterial(newName) > 0 Then N$T�zx��s
Print "Warning: A material named " & newName & " already exists." g�J$m�'kC;
End If 2Myz[)<P�_
��n!NA}�Oa
'Create material z����KG�]7
wavDelta = (wavEnd-wavStart)/(wavSteps-1) �K�DDx[]1Q
For wav = wavStart To wavEnd+0.00001 Step wavDelta -#�AO4xpI�
biref.wavelen = wav �kh>i�#9Ie
biref.NOrd = RefractiveIndex( matOrdId, wav ) '�1�\UF�z�
biref.NExt = RefractiveIndex( matExtraId, wav ) q ���}9n�.
biref.GOrd=0 ]�}_O�he]X
biref.GExt=0 =VZ0��+Y�l
xT+@0?�|�F
If wav = wavStart Then 'Create material ).$kp��2IN
id = AddBirefringentMaterial (newName, "Birefringent using " & GetMaterialName(matOrdId) & " (no) & " & GetMaterialName(matExtraId) & " (ne)", biref ) cW^u4%f't'
Else 'Add data to the list >LEp� EMJ\
AppendBirefringentMaterialSample id, biref N$8"X-na�?
End If �6�b4]dvl_
Next wav �r`:dUCF�E
��M:�K�4o%
'Set crystal axis o�-]8)G>~M
SetLength3D axis_x,axis_y,axis_z,1 Xk�p`1UT�H
SetBirefringentMaterialCrystalAxis id, axis_x, axis_y, axis_z � 0LU���w
k,[[�
CZ0j
Print "New birefringent material created: " & newName +�n<�;);h�
'49�4^1"io
Update �6�u�WPIM;
bLz��('mUY
End Sub L0��x��h?B
�d1��d:5�b
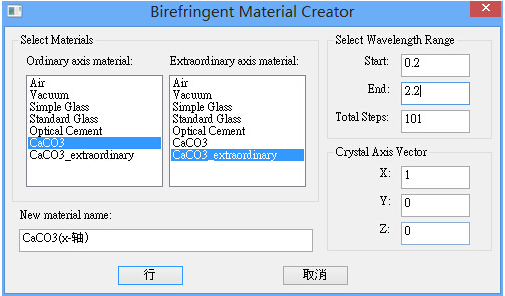
4. 运行后会出现如下对话框 LO�,k'g�g<
 )7N$lY<��� )7N$lY<���
在o光一栏选择CaCO3,在e光一栏选择CaCO3_extraoridinary, 4({W�i��pd
波长范围是0.2-2.2微米,步长101,光轴选择x轴(1 0 0) t�$U e�ks�
命名:CaCO3(x-轴)可,可根据实际情况命名。 =�$vy�_UN�
r�JcZ�� a#
点击最下面的“行”也就是确认按钮。 &���-`a�`
th�|TwD&mO
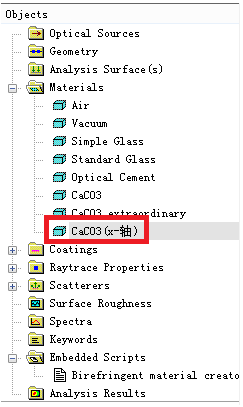
5. 现在查看树形文件Materia 下的CaCO3(x-轴)材料: Oj.xJ(uX+v
 jX9�1=�78d =�xHz�hh�� jX9�1=�78d =�xHz�hh�� 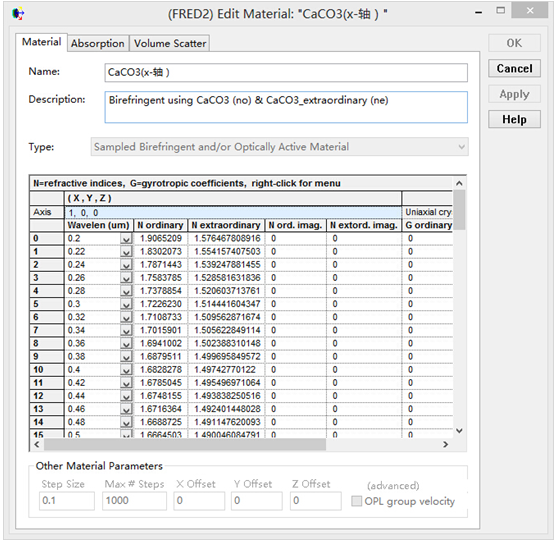 ��4:XV�u�� ��4:XV�u��
我们看到其材料类型为"Sampled Birefringent and/or Optically Active Material"。 |f"1I4K�g
现在双折射材料方解石在X轴方向的材料创建完成了,步骤3的脚本适用于任何的双折射材料。 N���s�`:=�
[~��IFg~*,
�%�0K�e4�c
练习: (k5�d.E]CK
!t�v�+,l&L
创建YVO4双折射材料,波长范围0.48-1.34,步骤101。 @>hXh
+!2h
|


